While every company is different, we’ve created a generalized structure to help you understand what sales teams look like at medical device companies.
In our next posts, we’ll dig into the responsibilities of the different sales roles available. Can’t wait to learn more? Click here: http://bit.ly/BITIP
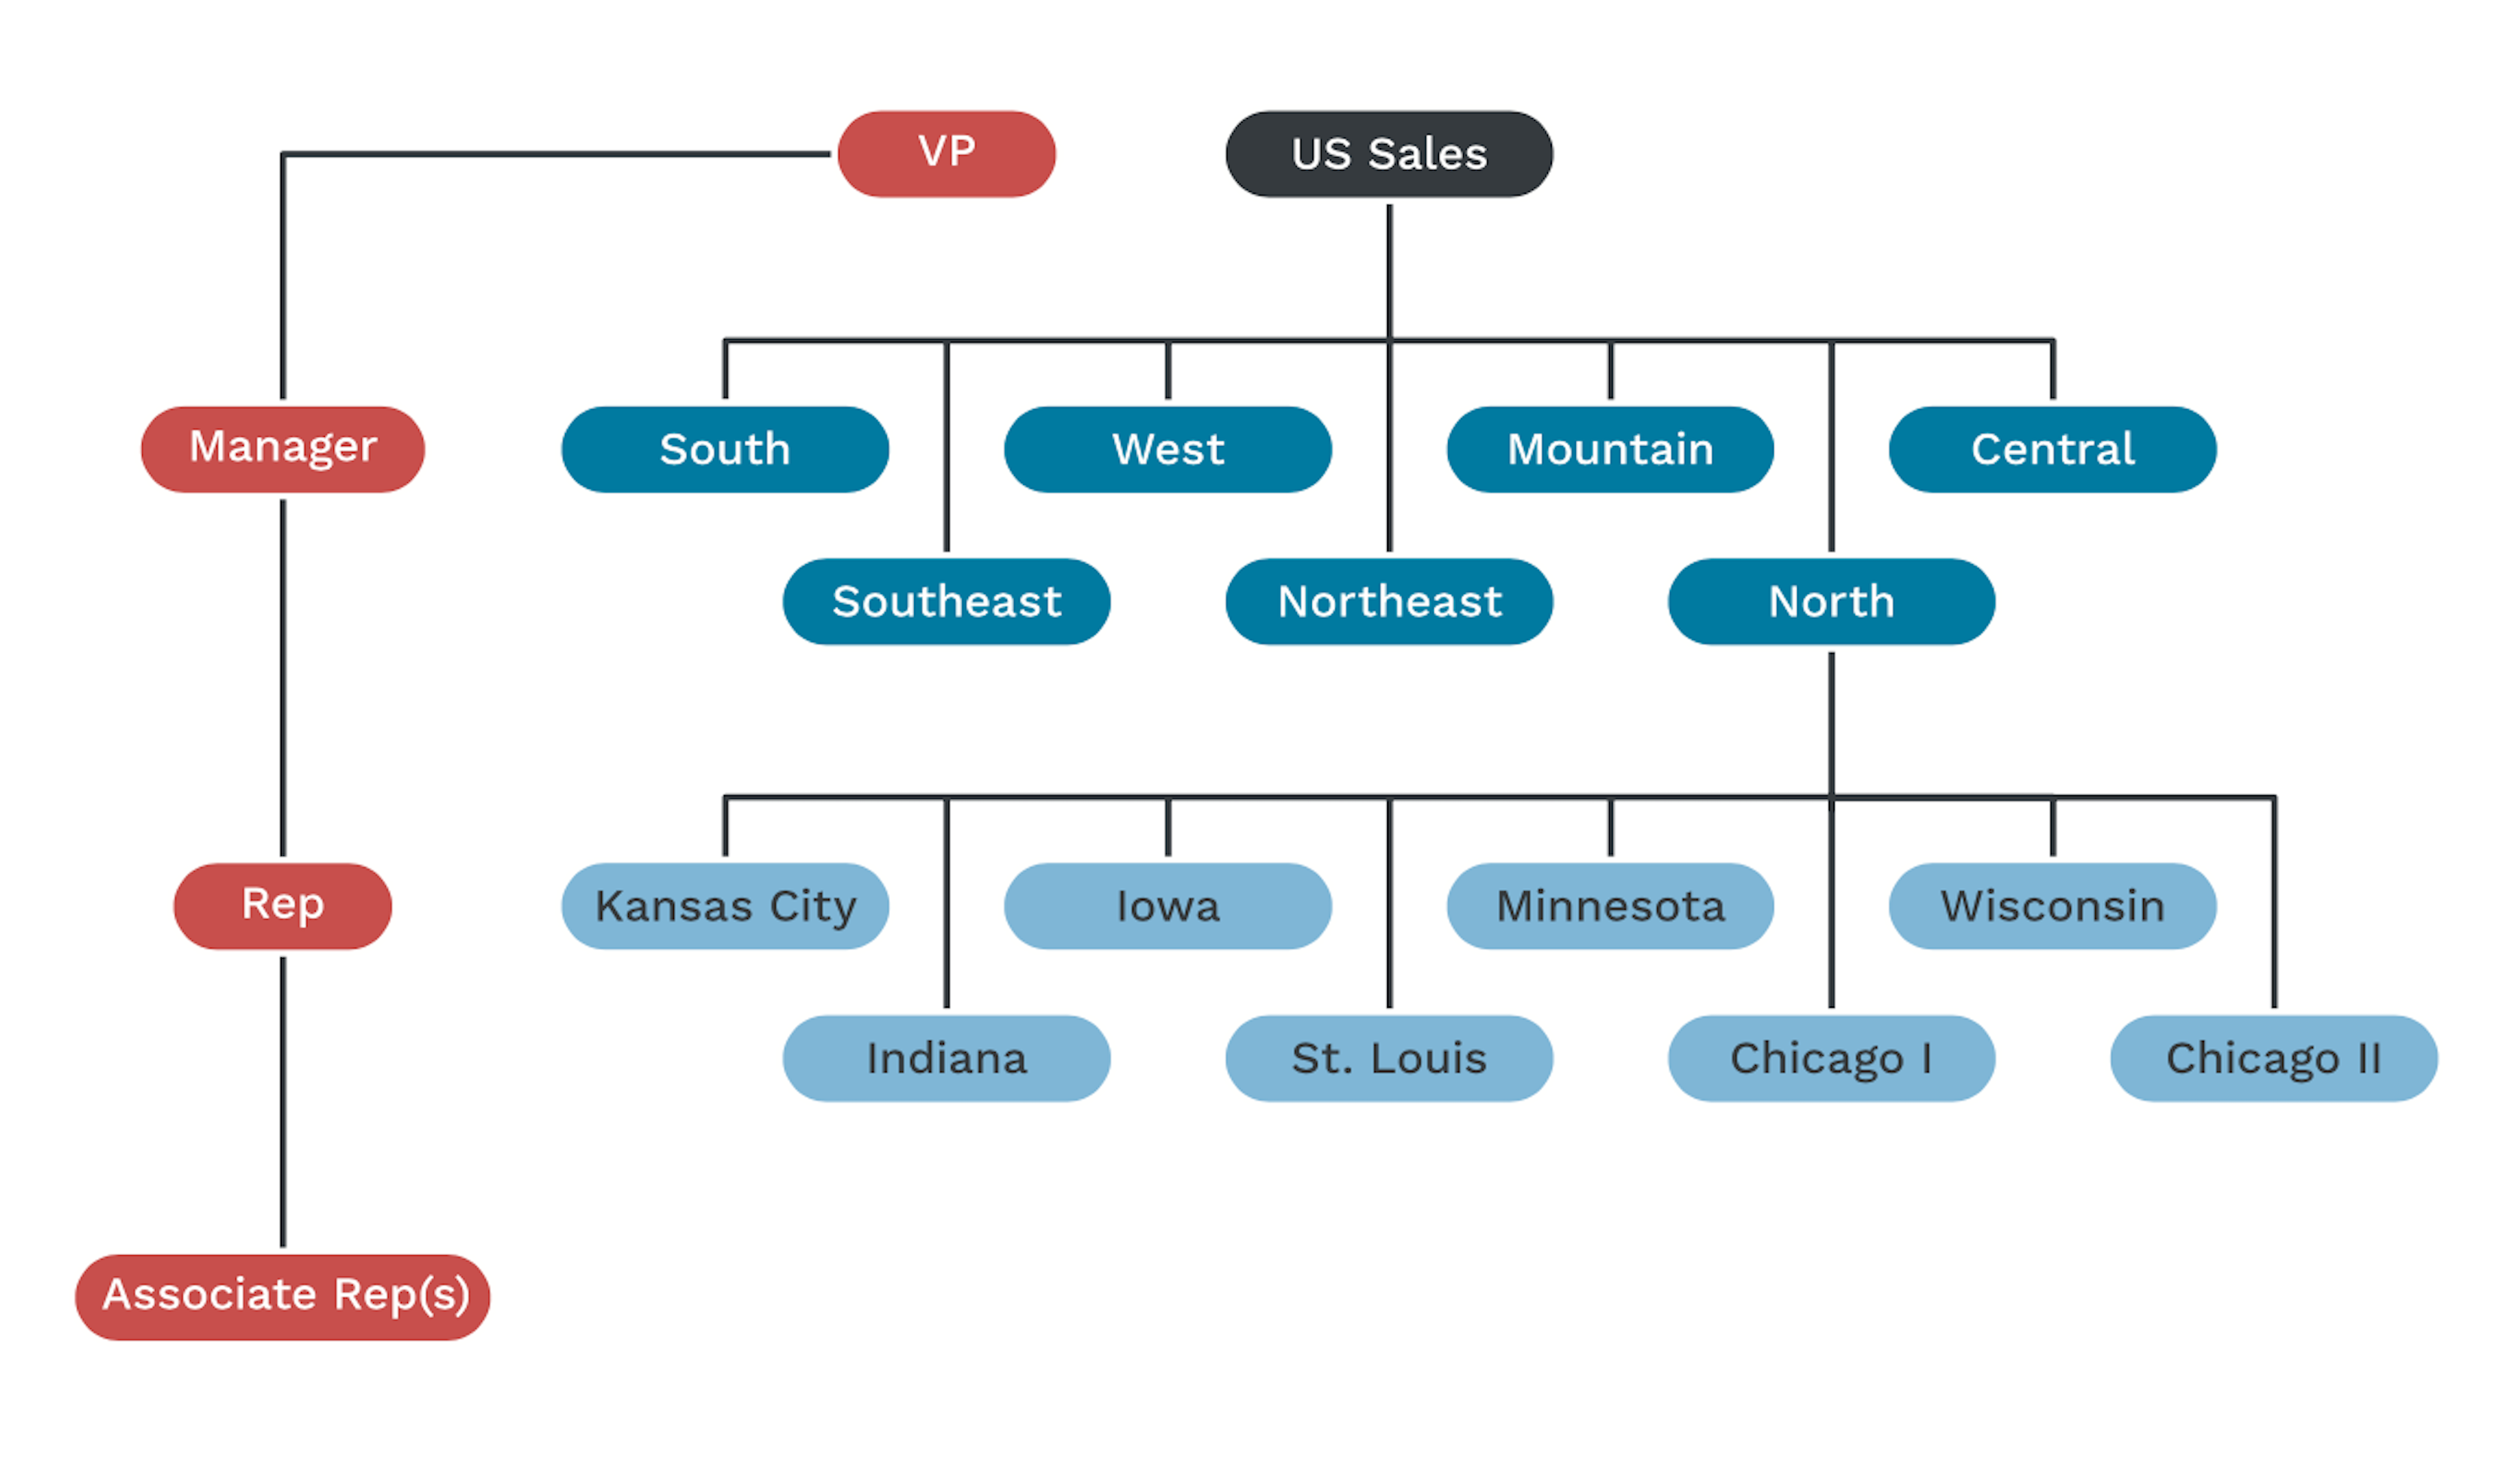
Org chart explanation:
The red ovals within this chart represent the job title. In contrast, the blue ovals illustrate the approximate number of employees in each role (notice only Reps located in the North Region are depicted in this chart for spacing purposes). Estimate a similar number of Reps in each of the other listed regions. Associate Reps/Clinical Specialists/Jr. Reps will typically serve a much larger geography than a Rep. In this depiction, one Associate Rep supports eight Reps within the North Region.